Migrating to OpenTelemetry: Future-proofing the SSV Client
SSV Network adopts OpenTelemetry in v2.1.0, enhancing observability, monitoring, and UX for node operators. Future-ready tooling!
The SSV Network DAO is excited to see SSV Labs release updated Monitoring and Observability tooling for the SSV client. This article was originally posted by the SSV Labs team. The SSV Network DAO will always highlight the community’s helpful contributions.
A big shoutout goes to Oleg I. for his excellent implementation work and Moshe, Yosher, Iurii, Alex Z., Massimo, and Vaclav from the SSV Labs team for their contributions to this project.
Note: 2.1.0 is now live!
As the SSV Network continues to grow, the need for robust monitoring and observability tooling is more critical than ever. SSV Network is a complex system with many moving elements, and visibility over a node’s performance has not always been as straightforward as a node operator.
For a few months, the SSV Labs team has taken steps to modernize the SSV client in terms of monitoring and observability. By keeping a close eye on the advancements in the observability space, the team has decided to embrace OpenTelemetry (OTel) as the standard for observability instrumentation by replacing the Prometheus libraries currently in use with a complete drop-in replacement. In this post, we’ll go over some of the changes shipping with the SSV client version 2.1.0 and the benefits that come with it, as well as what it means for the future of the SSV client.
You can find the latest docs here.
Observability is not as simple as just monitoring; it’s about proactive exploration rather than reactive problem detection. Historically, the monitoring space has always been fragmented regarding standards and tools. In many cases, vendors were always in the driver’s seat, and users had to adapt to the tools they provided. This has led to many instances of vendor lock-in and a lack of interoperability between tools.
OpenTelemetry is an open-source project (part of CNCF) that aims to tackle that problem by providing a single set of APIs, libraries, agents, and instrumentation to capture distributed traces, metrics, and application logs. But more importantly, it aims to be a universal standard for observability, allowing users to choose the tools they want to use without worrying about compatibility.
By moving towards technology-agnostic standards, we are future-proofing the SSV client and, ultimately, moving in a direction where users decide what tools and vendors they want to use in a way that aligns with their infrastructure and business needs.
To break, or not to break? That is the question.
One of the team’s main concerns when deciding to migrate to OpenTelemetry was the impact it would have on SSV Network users. The aim is to ensure that the migration is as seamless as possible and that users won’t have to change their monitoring setup.
A few considerations:
Ultimately, the team decided to do a complete drop-in replacement, not to maintain two simultaneous “ways of exposing telemetry” within the client.
OpenTelemetry has the notion of exporters, so the first iteration focuses on using the OpenTelemetry Prometheus exporter. This means that end users will not have to change anything in their setup. As soon as they upgrade to the new version, they will start seeing metrics in their Prometheus instance as they did before.
The team also took this refactoring opportunity as a means to improve the visibility across the SSV client. Previously, many engineers working on different parts of the client had to implement their own metrics, which led to duplication and inconsistency. With this refactor, it’s possible to have a more unified and consistent way of exposing metrics across the client.

Now, there are more metrics, a lot more than before! The team identified the most critical metrics to expose and made sure that they were available across all the components of the client. This means it’s possible to add attributes that provide the context needed to better understand the client’s behavior throughout the lifecycle of validator duties.
Some of the covered systems include:
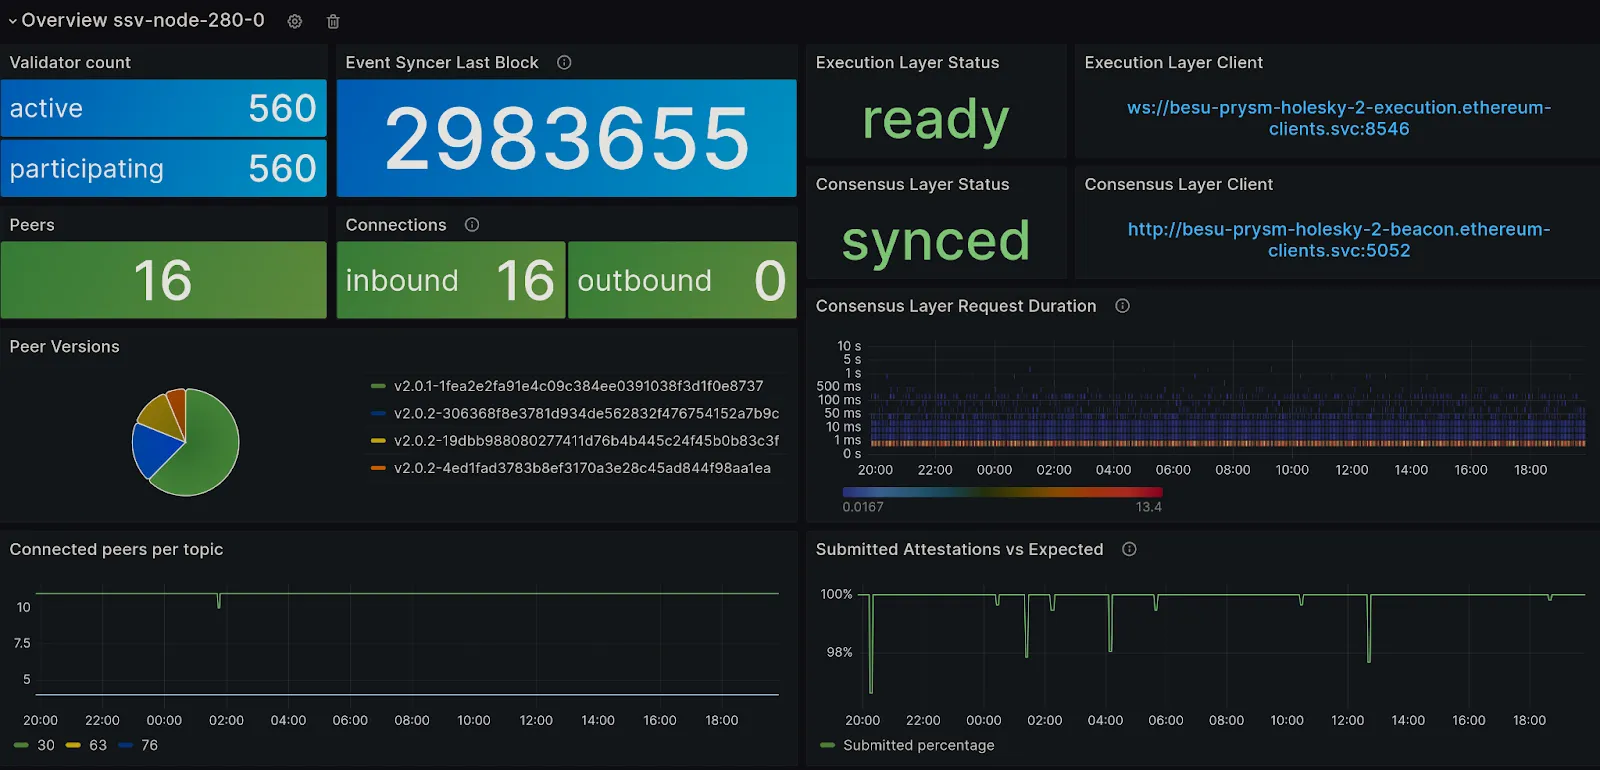
The overview panels simplify some of the complexity of all the new metrics.

Though it may initially seem overwhelming, these will provide many insights that may have gone under the radar.
You can check the changelog for a full list of all changes included in 2.1.0.
All this metric stuff is exciting, but it’s just the beginning. We are now in a position where we can start leveraging the full power of OpenTelemetry as a growing ecosystem.
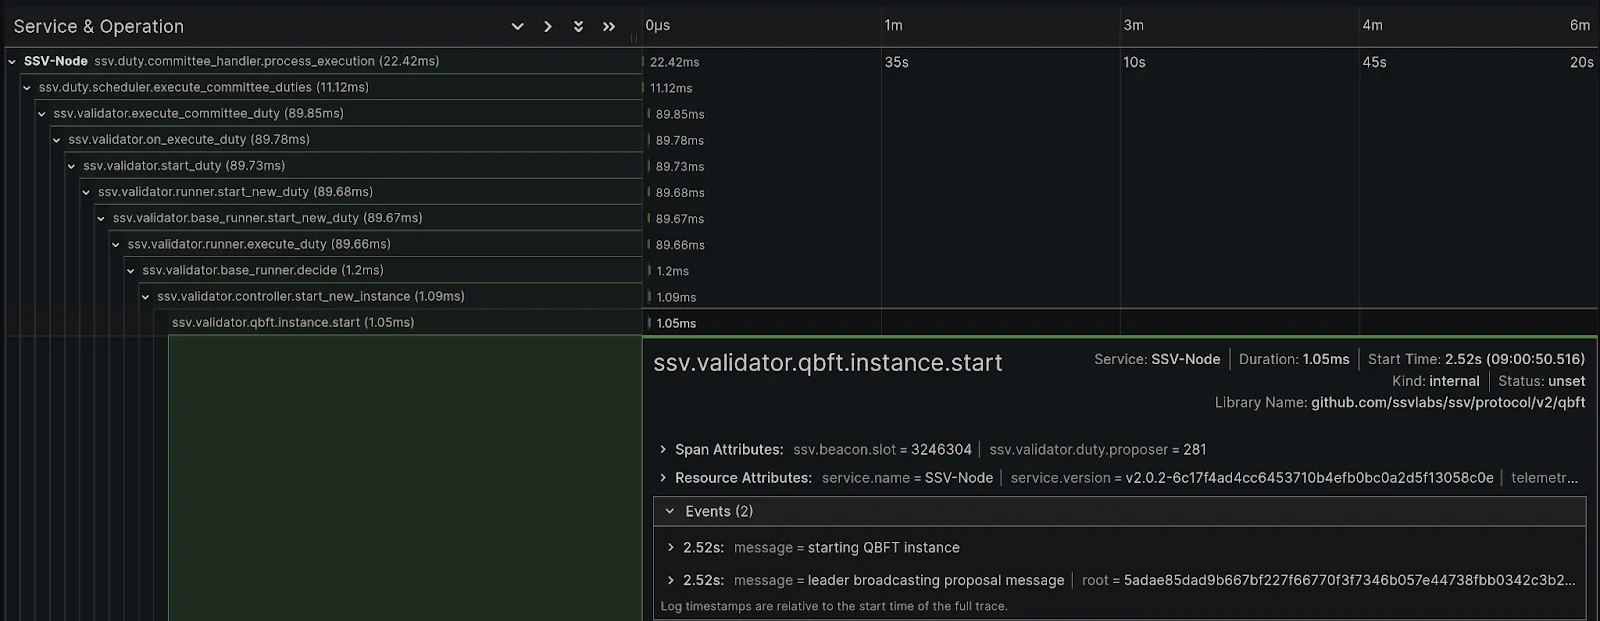
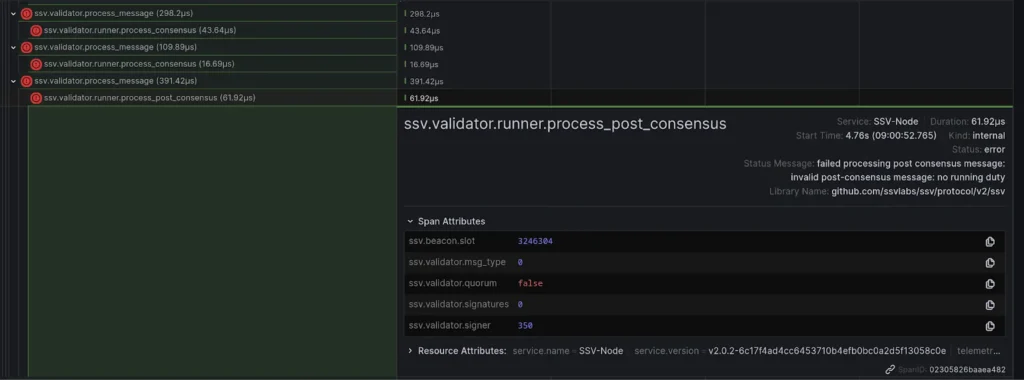
Due to its distributed nature, troubleshooting issues in SSV has always been inherently tricky. Tracing is a powerful tool that can help understand the flow of Ethereum duties an SSV node is performing, both at a single-node level and potentially on a multi-node level (if you run multiple SSV nodes and can collect traces across them). This will also significantly increase developer productivity when it comes to debugging and understanding the client’s behavior and open new avenues of optimization opportunities.

This also unlocks the ability to embed high cardinality data that can be queried via span attributes, providing a much more “human-like” reconstruction of events that take place in an SSV node since it is naturally ordered by timestamp. Metrics, for example, are never a good solution to high-cardinality data due to the way that time series databases structure data.

This extends query capabilities beyond what was previously possible with logs or metrics: users can do an open search based on elements such as function duration, whether it errored, specific slots, SSV quorum, and many more.
Now that the client is significantly decoupled from the Prometheus libraries and only utilizes a Prometheus exporter from an already agnostic library, changing how metrics are emitted would be nearly trivial. This change will allow us to look into other formats like OTLP. For example, with the use of an OpenTelemetry Collector, we could start sending metrics to a variety of backends:
This is just one example of the many possibilities that OpenTelemetry brings to the table, along with many processors and exporters that can enrich and transform telemetry data. You can read more about the OpenTelemetry Collector here.
Logs are also a big part of the equation when it comes to interoperability and something worth exploring in the future, as they are also standardized in OpenTelemetry.
The SSV Labs team is excited about these upcoming improvements and the potential they bring to the SSV client. We are always looking at ways to make it more accessible for users to reason about the client’s behavior and performance, and we believe that OpenTelemetry is a big step in that direction.
Website | Builders Hub | Network Hub | Discord | Dev Center | Documentation | GitHub